Bay Area · 13 grocers · Fragmented
the non-alcoholic wine aisle
Bay Area's non-alcoholic wine aisle is a fragmented shelf spread across many brands: 153 products from 57 brands across 13 grocers. leitz owns the most shelf · 11% of SKUs, ahead of fre. Store brands hold 1%. The shelf leans dairy-free · 1% of SKUs carry that claim. Verdict: fragmented · a crowded free-for-all with no clear structure (opportunity 61/100).
153
products
57
brands
$22.90
avg price
$0.40-$2.59 /fl oz
typical range
More in Non-Alcoholic (Adult)
Who owns the shelf
brands by share of the non-alcoholic wine shelf.
Brand positioning
every brand by share of shelf × price. bubble size = the brand's total reach across all aisles; color = positioning stance. top-right owns the premium end; bottom-right owns the mainstream.
scale
Color:indulgentbetter-for-you
Size:total brand reach (SKUs across all aisles)
price normalized per fl oz (sizes vary)7 omitted (no fl oz size)4 omitted (no image)showing the 24 biggest of 27 brandsAll stores combined.
Market structure
96
highBrand competition
how many brands compete
87
highVariety of offers
how differentiated the shelf is
4
lowTop-brand grip
how much a few brands dominate
61
medLaunch whitespace
room for a new brand
store-brand share: 1% · scores 0-100.
Top products
the non-alcoholic wine products in the most Bay Area grocers · widest distribution first.

Ghia Non-Alcoholic Apéritif
$5.895 grocers
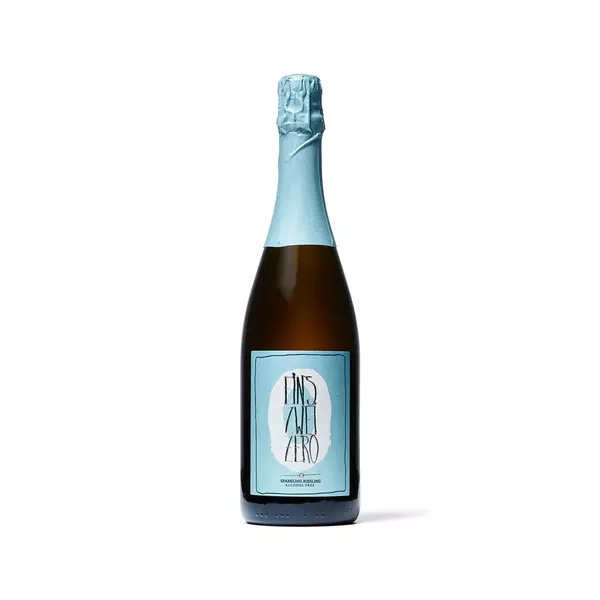
Leitz Winery Eins Zwei Zero Alcohol-Free Riesling
$8.094 grocers
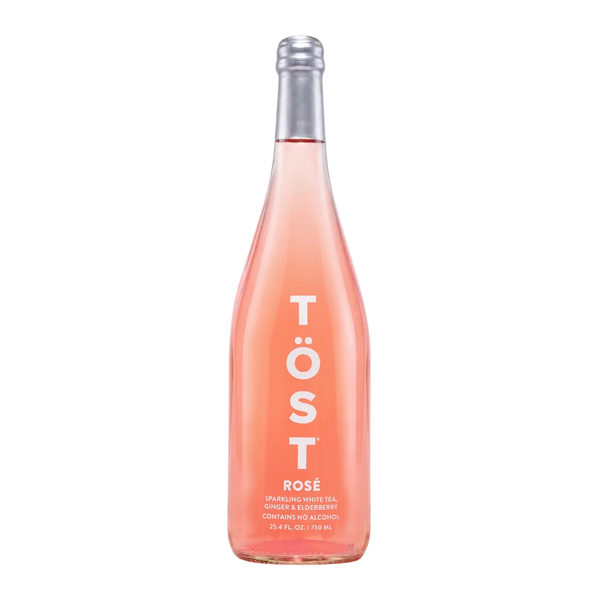
TÖST Alcohol-Free, Sparkling Rosé Refresher
$8.994 grocers
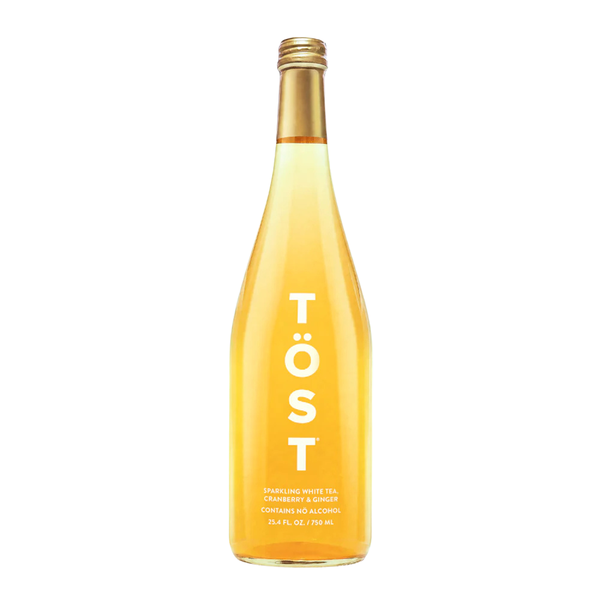
TÖST Alcohol-Free, Sparkling Refresher
$8.994 grocers
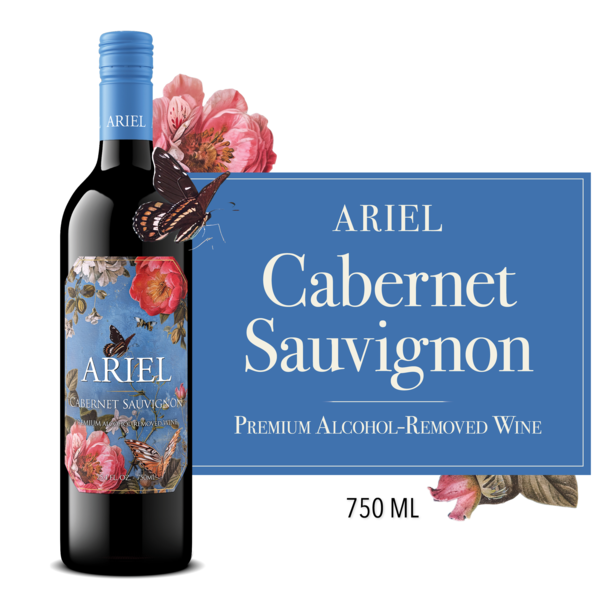
J. Lohr Non-Alcoholic Cabernet Sauvignon
$11.794 grocers
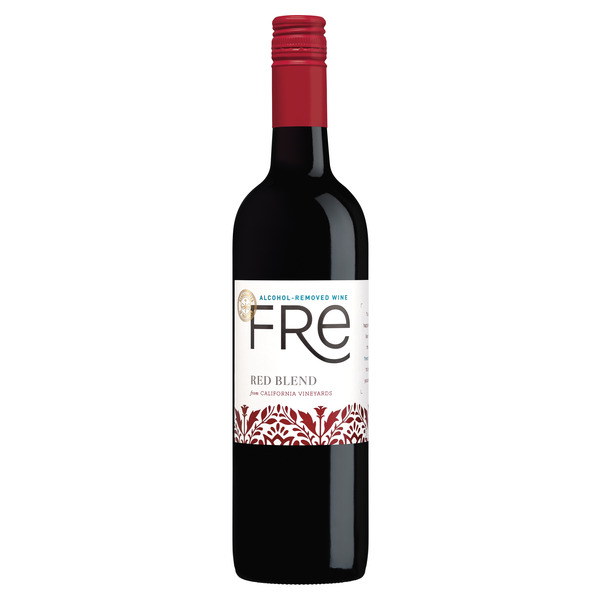
FRE California Red Wine Blend, Alcohol-Removed, 750 ml Glass Bottle, 0% ABV
$11.993 grocers
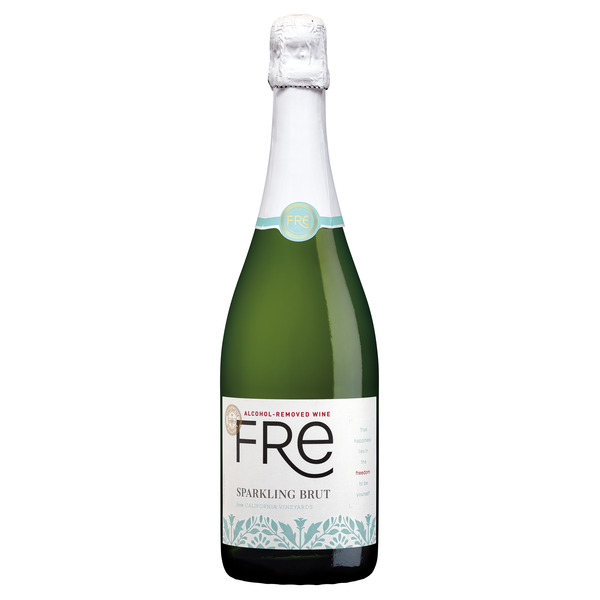
FRE Sparkling Brut California Wine, Alcohol-Removed, 750 ml Glass Bottle, 0% ABV
$12.993 grocers
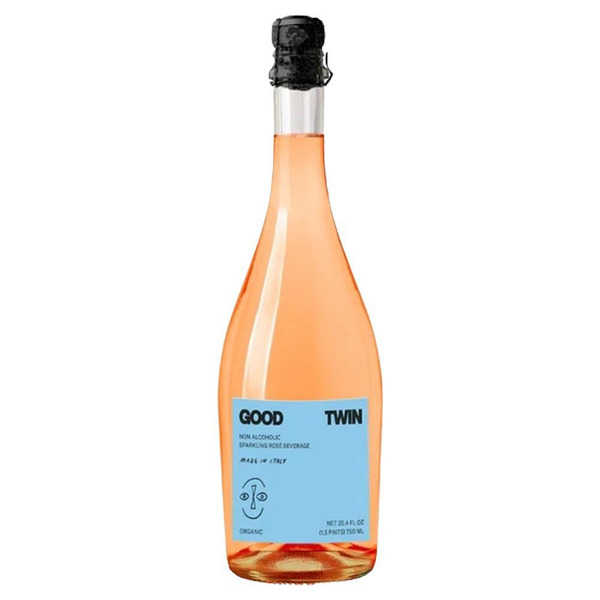
Good Twin Organic Non Alcoholic Sparkling Rose Beverage
$17.693 grocers
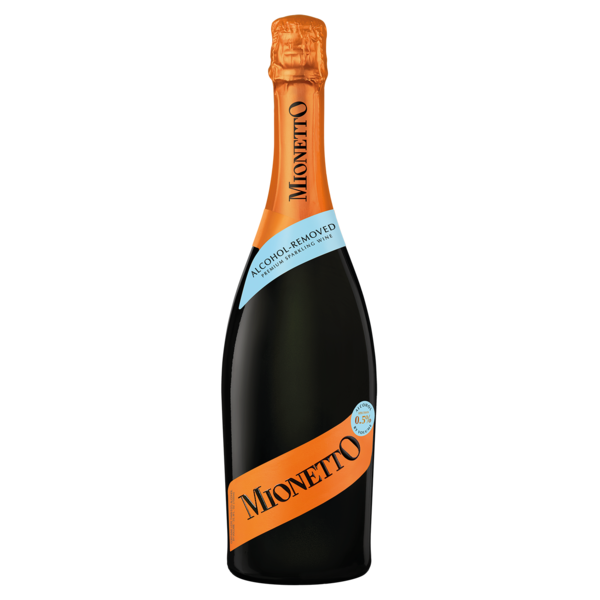
Mionetto Alcohol-Removed Sparkling Wine 750ml
$17.693 grocers
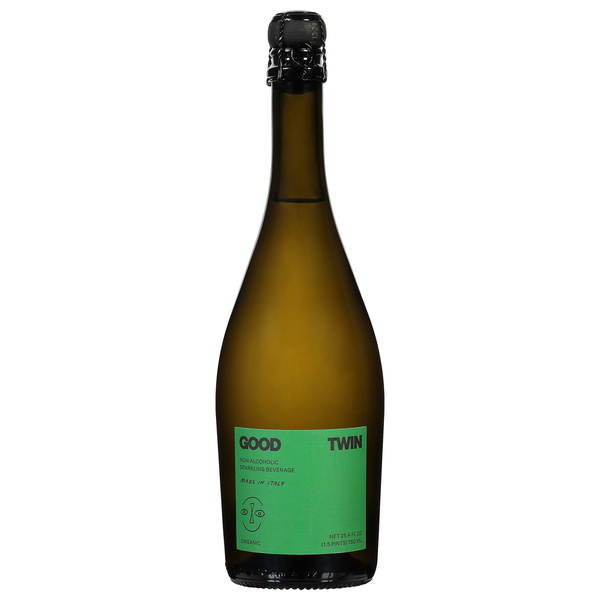
Good Twin Organic Non Alcoholic Sparkling Beverage
$17.693 grocers