Bay Area · 7 grocers · Contested
the lip balm & lip treatment aisle
Bay Area's lip balm & lip treatment aisle is a fragmented shelf spread across many brands: 54 products from 15 brands across 7 grocers. burt's bees owns the most shelf · 28% of SKUs, ahead of hurraw!. The shelf leans organic · 6% of SKUs carry that claim. Verdict: contested · real competition, no single winner (opportunity 66/100).
54
products
15
brands
$6.77
avg price
$11.96-$66.38 /oz
typical range
Who owns the shelf
brands by share of the lip balm & lip treatment shelf.
Brand positioning
every brand by share of shelf × price. bubble size = the brand's total reach across all aisles; color = positioning stance. top-right owns the premium end; bottom-right owns the mainstream.
scale
Color:indulgentbetter-for-you
Size:total brand reach (SKUs across all aisles)
price normalized per oz (sizes vary)2 omitted (no oz size)All stores combined.
Market structure
57
medBrand competition
how many brands compete
61
medVariety of offers
how differentiated the shelf is
11
lowTop-brand grip
how much a few brands dominate
66
medLaunch whitespace
room for a new brand
store-brand share: 0% · scores 0-100.
Top products
the lip balm & lip treatment products in the most Bay Area grocers · widest distribution first.
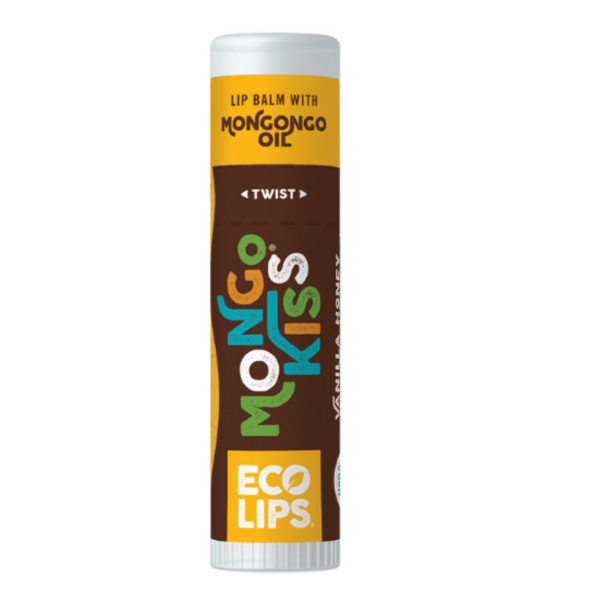
Eco Lips Mongo Kiss Vanilla Honey Lip Balm
$3.292 grocers
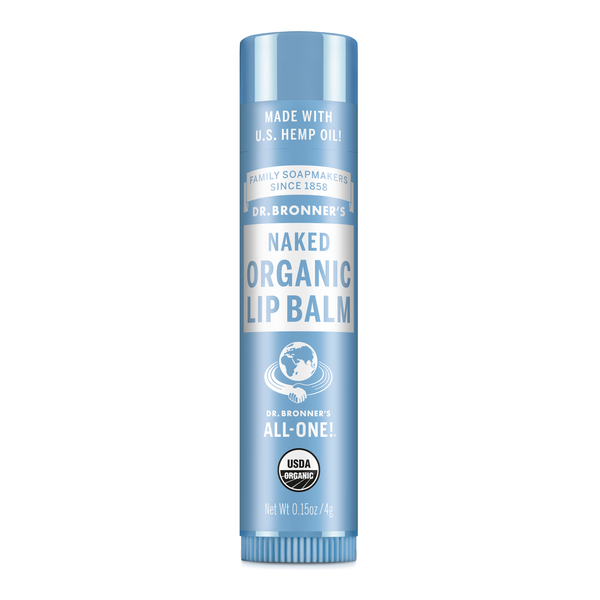
Dr. Bronner's Naked Unscented, Organic Lip Balm
$4.292 grocers
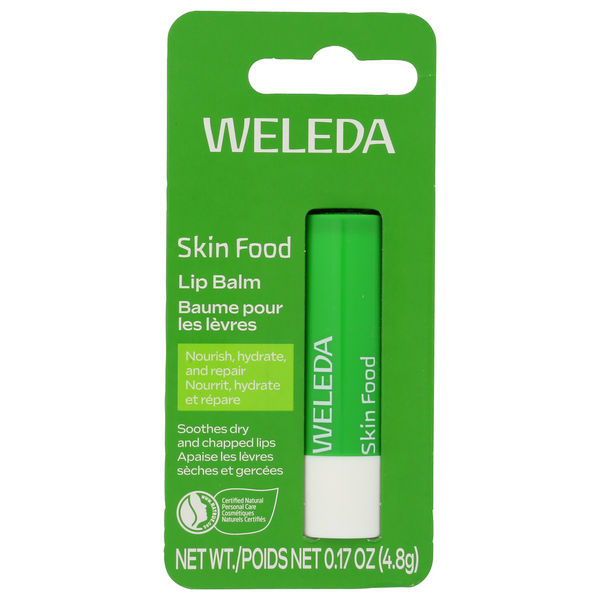
Weleda Skin Food Lip Balm
$8.592 grocers
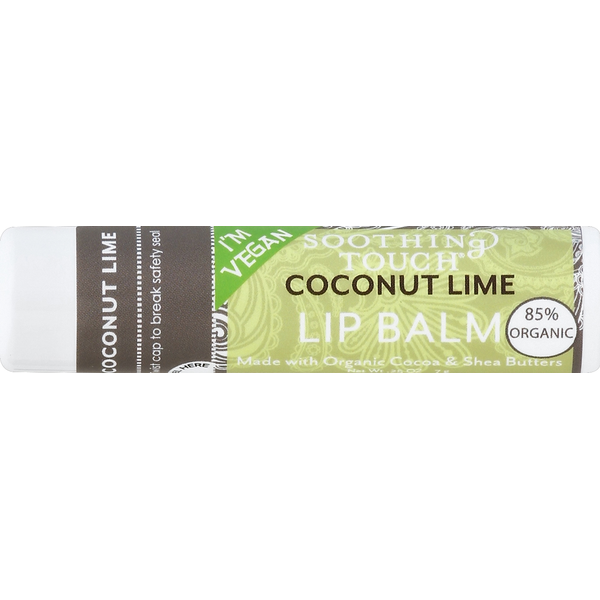
Soothing Touch Lip Balm, Coconut Lime
$2.791 grocer
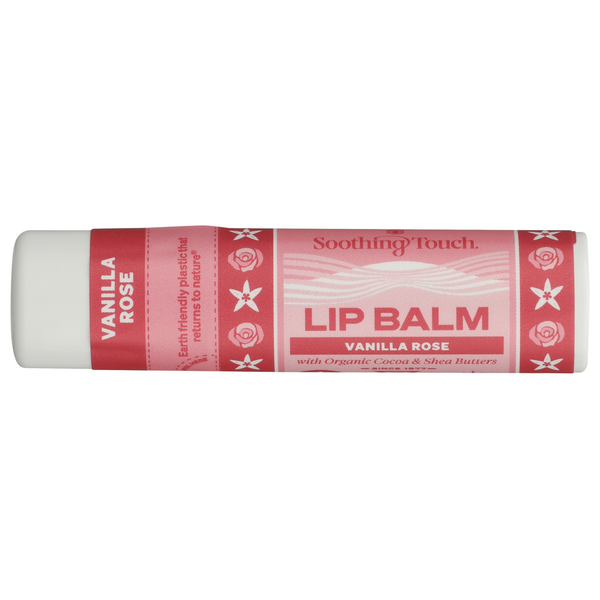
Soothing Touch Vanilla Rose Lip Balm, Org, Vegan
$2.791 grocer

Humble Brands Moroccan Rose Lip Balm
$3.091 grocer
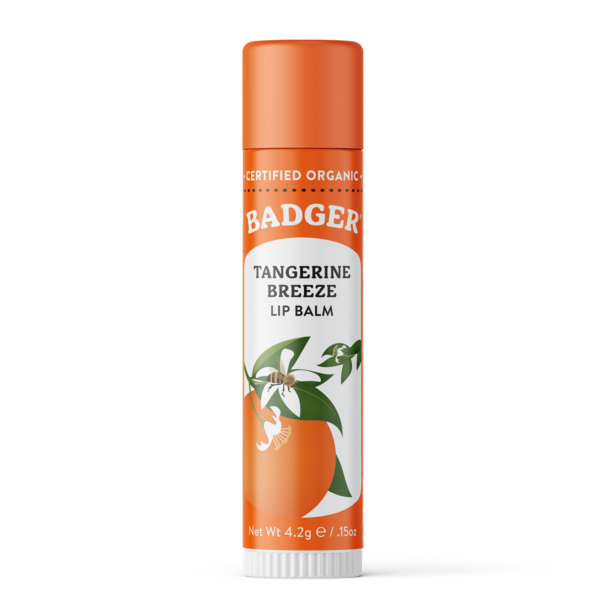
Badger Classic Lip Balm, Tangerine Breeze
$4.391 grocer
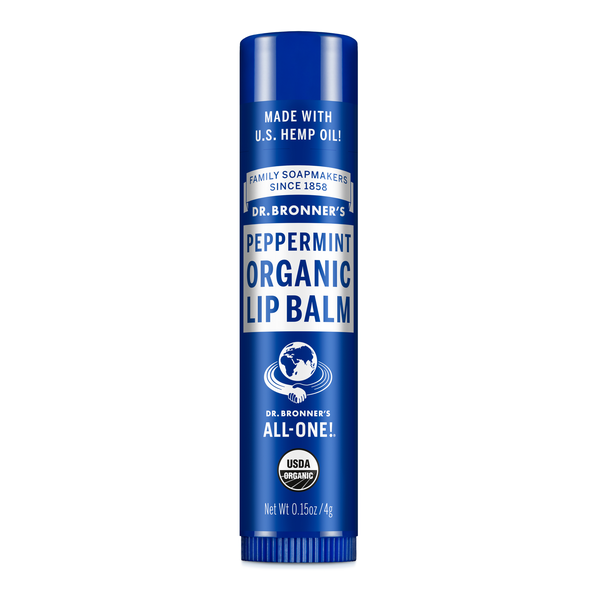
Dr. Bronner's Peppermint, Organic Lip Balm
$4.391 grocer
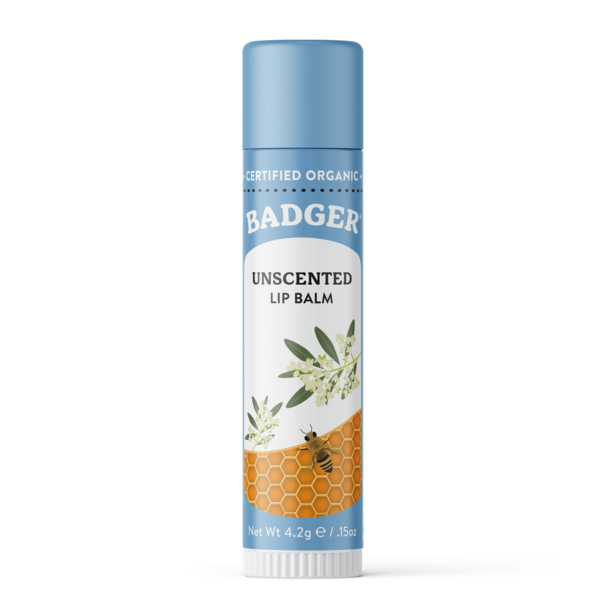
Badger Classic Lip Balm, Unscented
$4.391 grocer
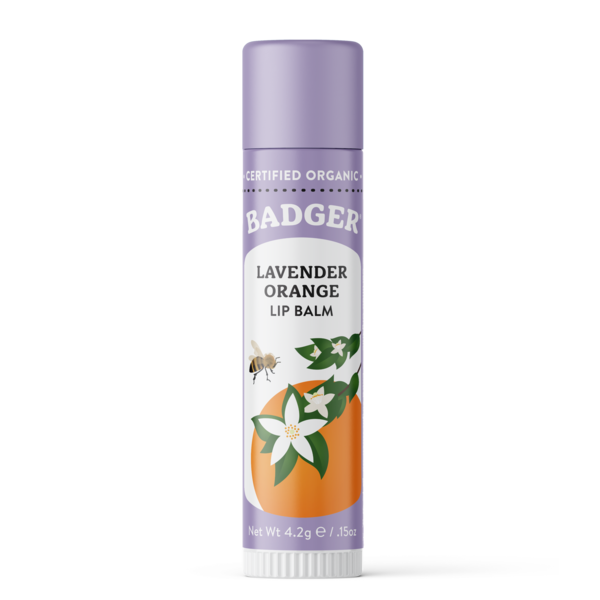
Badger Classic Lip Balm, Lavender Orange
$4.391 grocer