Bay Area · 5 grocers · Contested❄️ heat 8 · COOL
the sake aisle
Bay Area's sake aisle is a fragmented shelf spread across many brands: 28 products from 20 brands across 5 grocers. sequoia sake owns the most shelf · 11% of SKUs, ahead of hakutsuru. Verdict: contested · real competition, no single winner (opportunity 70/100).
28
products
20
brands
$15.74
avg price
$2.99-$34.00
typical range
More in Spirits
Who owns the shelf
brands by share of the sake shelf.
Brand positioning
every brand by share of shelf × price. bubble size = the brand's total reach across all aisles; color = positioning stance. top-right owns the premium end; bottom-right owns the mainstream.
scale
Color:no dominant segmentation on this shelf
Size:total brand reach (SKUs across all aisles)
price normalized per fl oz (sizes vary)11 omitted (no fl oz size)1 omitted (no image)All stores combined.
Market structure
67
highBrand competition
how many brands compete
49
medVariety of offers
how differentiated the shelf is
6
lowTop-brand grip
how much a few brands dominate
70
highLaunch whitespace
room for a new brand
store-brand share: 0% · scores 0-100.
Top products
the sake products in the most Bay Area grocers · widest distribution first.
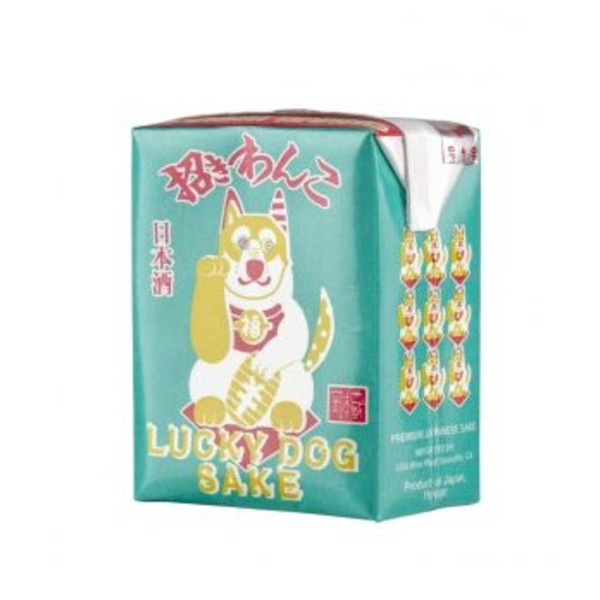
Maneki Wanko Lucky Dog
$6.492 grocers
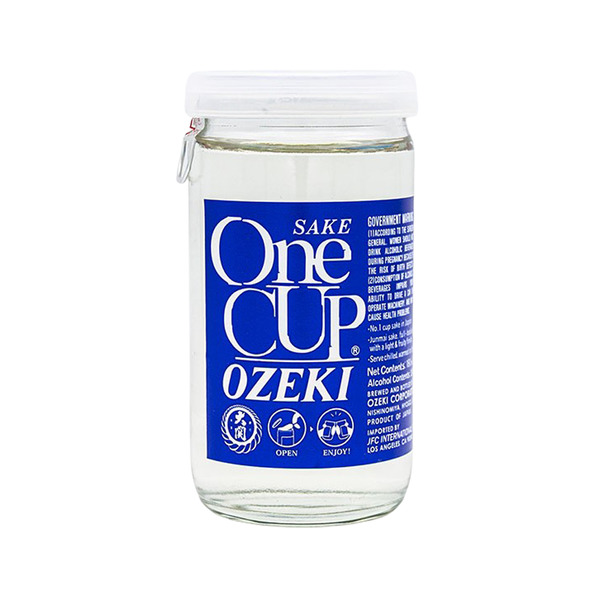
Ozeki One Cup Sake
$2.991 grocer
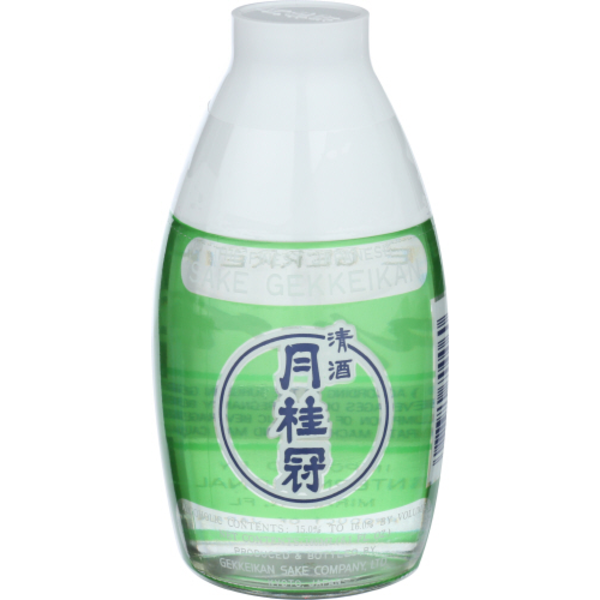
Gekkeikan Cap Ace
$4.991 grocer
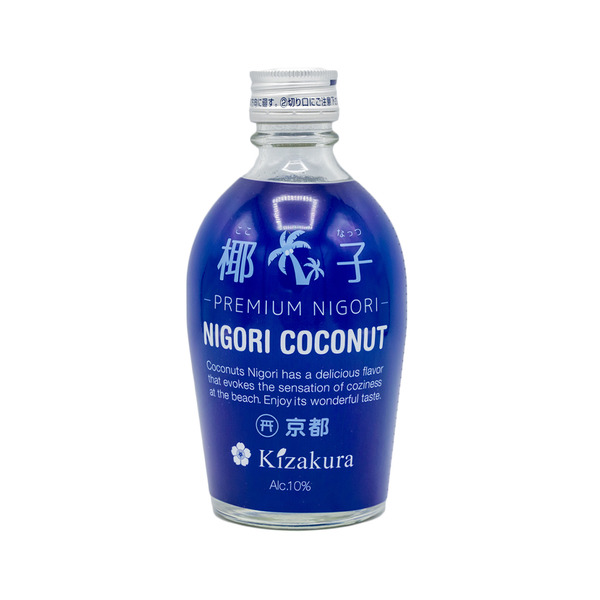
Kizakura Coconut Nigori Sake
$5.991 grocer
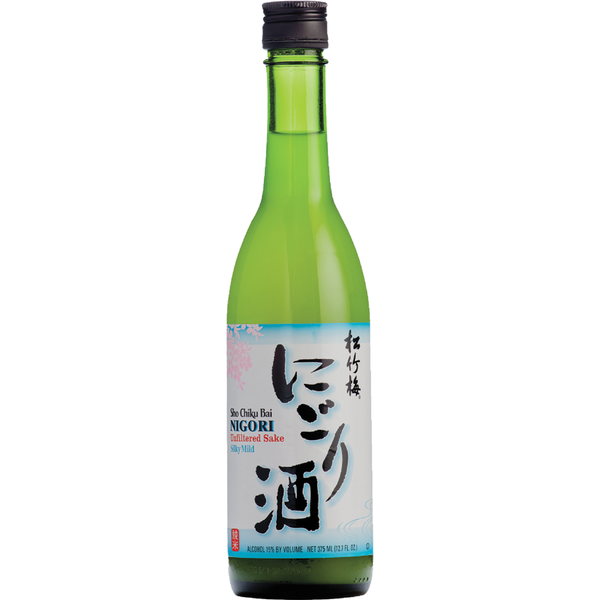
Sho Chiku Bai Nigori Silky Mild
$6.591 grocer
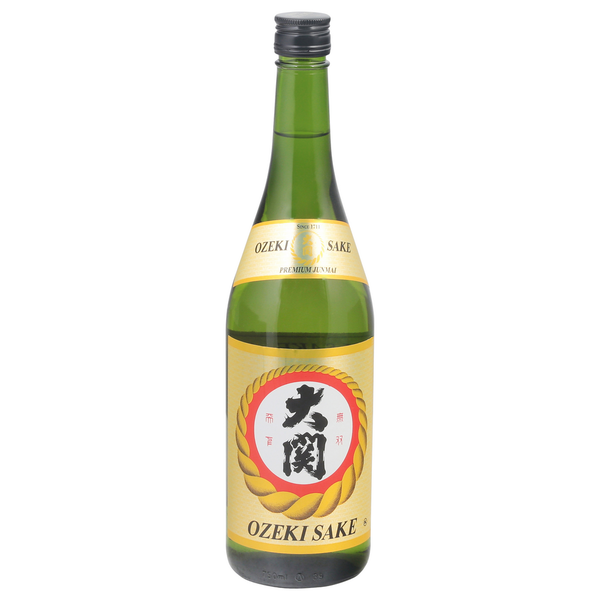
Ozeki Premium Junmai Sake
$6.991 grocer
no image
Otokoyama Tsunami Sushi Booster Tokubetsu Junmai
$8.991 grocer
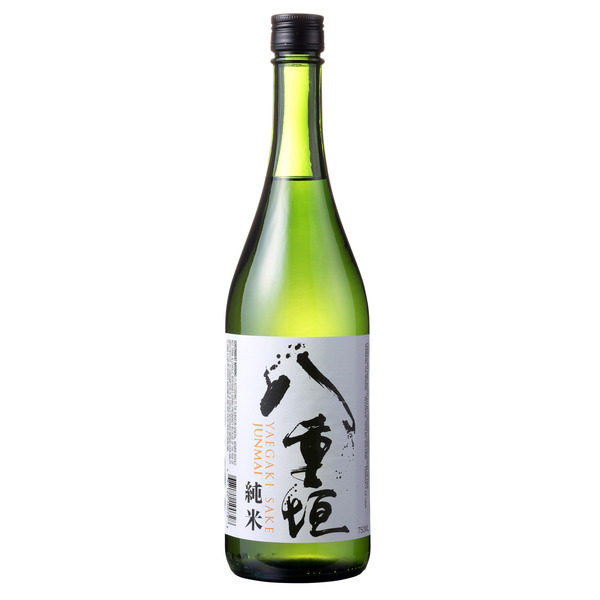
Yaegaki Junmai Sake
$8.991 grocer
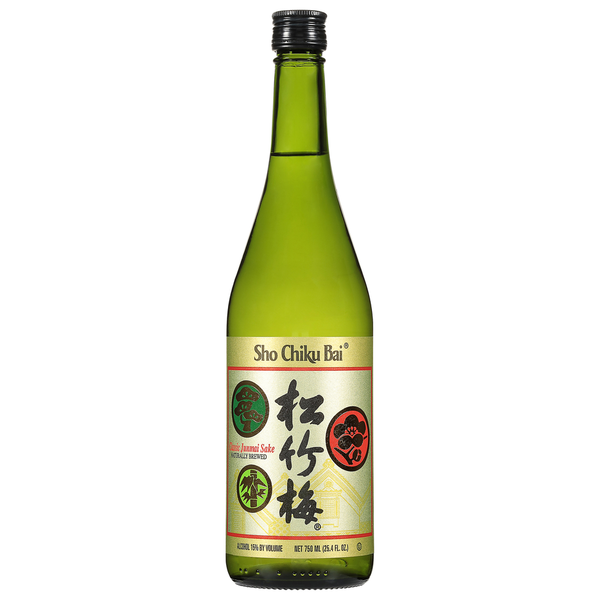
Sho Chiku Bai Classic Junmai Sake
$8.991 grocer
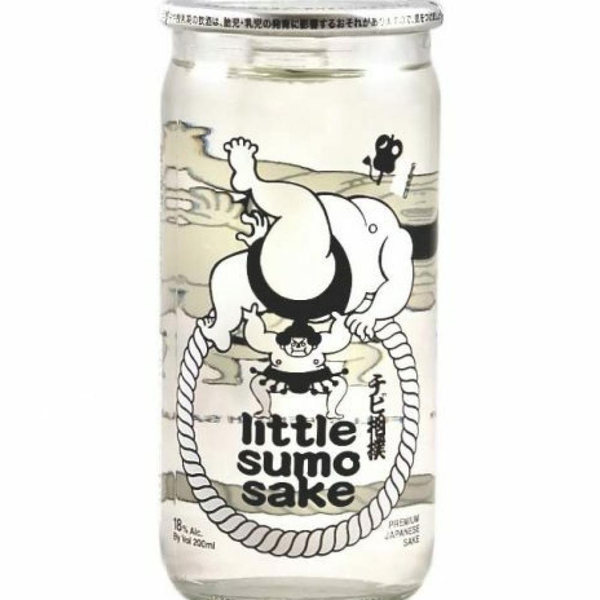
Little Sumo Sake Premium Japanese Sake
$9.791 grocer