Bay Area · 23 grocers · Fragmented
the fruit & cream soda aisle
Bay Area's fruit & cream soda aisle is a fragmented shelf spread across many brands: 563 products from 88 brands across 23 grocers. zevia owns the most shelf · 12% of SKUs, ahead of jarritos. Store brands hold 4%. The shelf leans vegan · 1% of SKUs carry that claim. Verdict: fragmented · a crowded free-for-all with no clear structure (opportunity 51/100).
563
products
88
brands
$5.51
avg price
$0.06-$0.59 /fl oz
typical range
More in Soda & Soft Drinks
Who owns the shelf
brands by share of the fruit & cream soda shelf.
Brand positioning
every brand by share of shelf × price. bubble size = the brand's total reach across all aisles; color = positioning stance. top-right owns the premium end; bottom-right owns the mainstream.
scale
Color:indulgentbetter-for-you
Size:total brand reach (SKUs across all aisles)
price normalized per fl oz (sizes vary)2 omitted (no fl oz size)1 omitted (no image)All stores combined.
Market structure
99
highBrand competition
how many brands compete
90
highVariety of offers
how differentiated the shelf is
3
lowTop-brand grip
how much a few brands dominate
51
medLaunch whitespace
room for a new brand
store-brand share: 4% · scores 0-100.
Top products
the fruit & cream soda products in the most Bay Area grocers · widest distribution first.
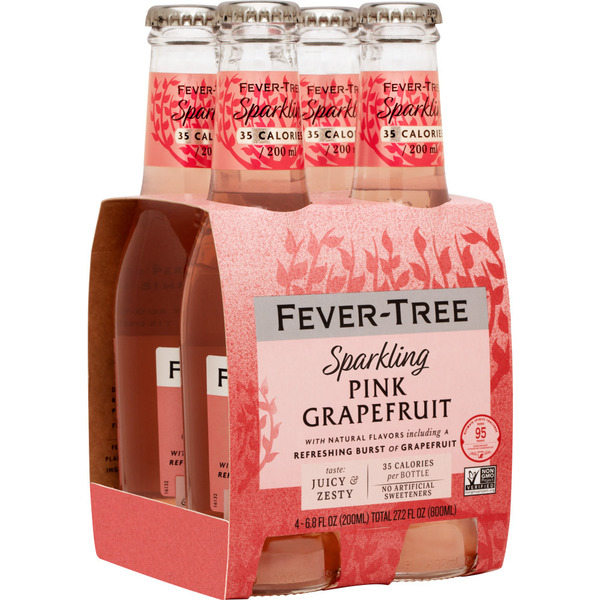
Fever-Tree Sparkling Pink Grapefruit Soda, 4-pack, 6.76oz Bottle, 0.0% ABV
$7.2911 grocers
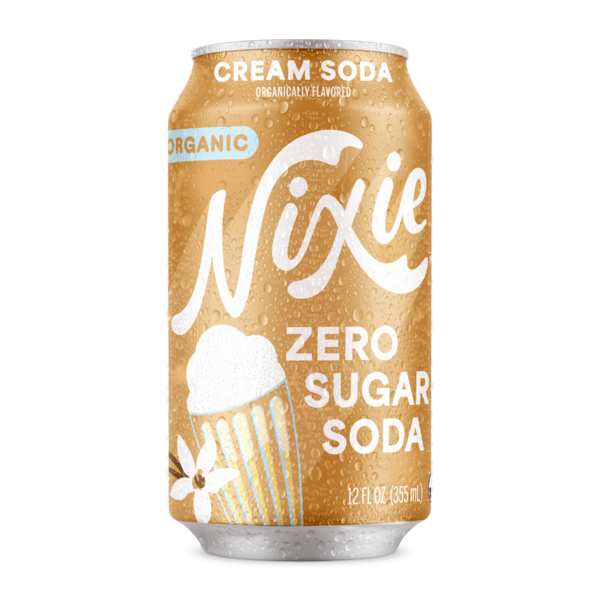
Nixie Cream Soda Organic Zero Sugar Soda
$2.298 grocers
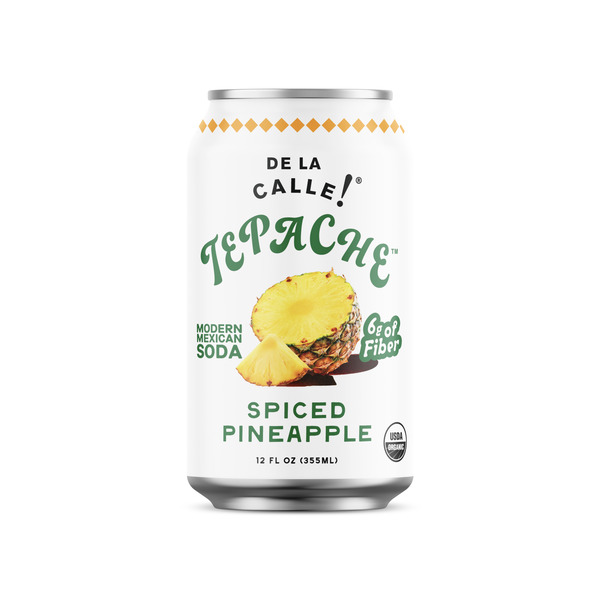
De La Calle Tepache Spiced Pineapple
$2.998 grocers
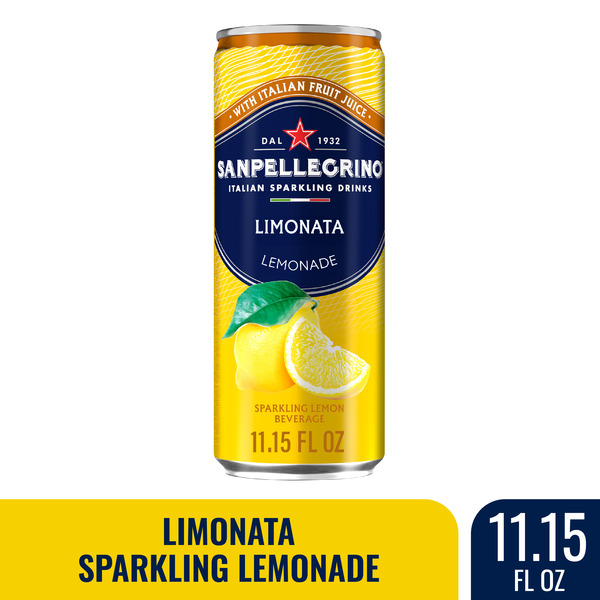
San Pellegrino Italian Sparkling Drink Limonata
$1.697 grocers
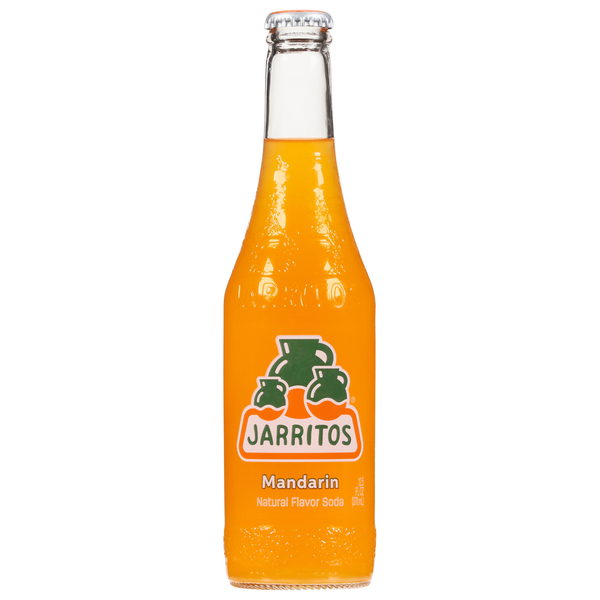
Jarritos Mandarin Soda
$1.797 grocers
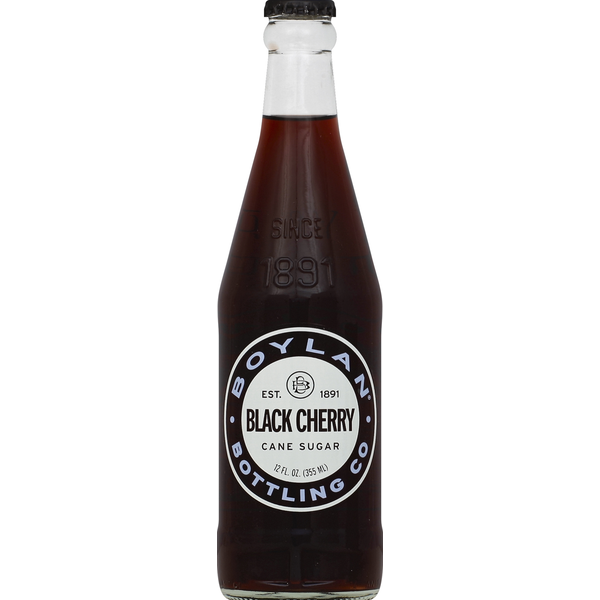
Boylan Bottling Soda, Black Cherry
$2.497 grocers
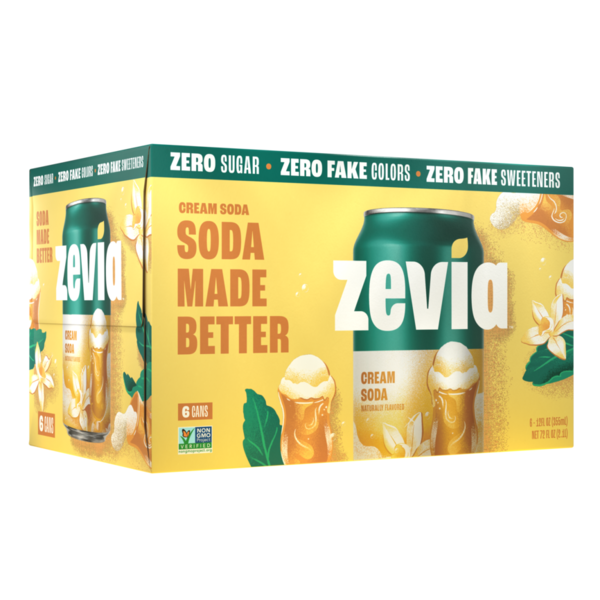
Zevia Soda, Zero Sugar, Cream Soda
$6.697 grocers
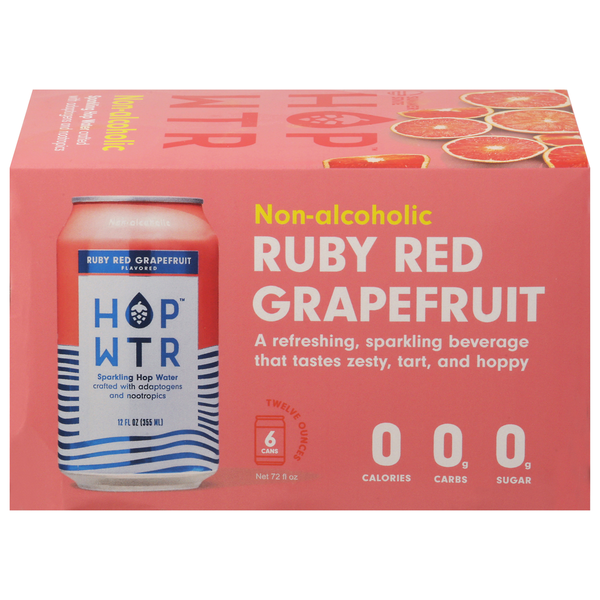
HOP WTR Sparkling Hop Water, Ruby Red Grapefruit, Non-Alcoholic
$8.897 grocers
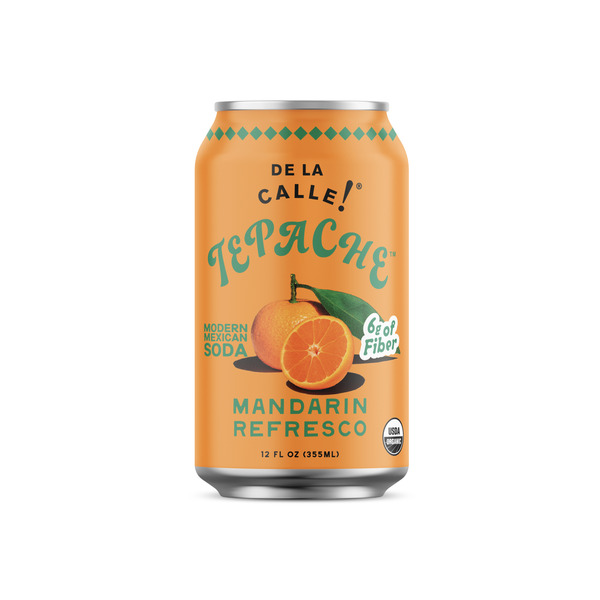
De La Calle Tepache Mandarin Refresco
$1.996 grocers
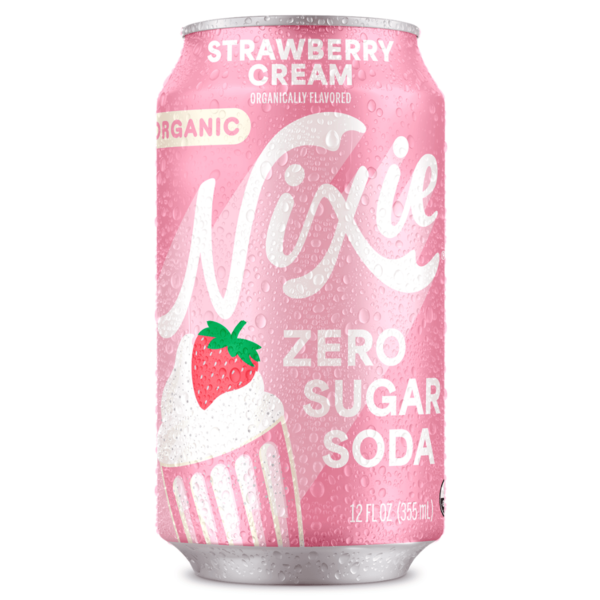
Nixie Strawberry Cream, Organic Zero Sugar Soda
$2.496 grocers