Bay Area · 19 grocers · Contested❄️ heat 27 · COOL
the coconut milk aisle
Bay Area's coconut milk aisle is a competitive shelf with clear leaders: 110 products from 16 brands across 19 grocers. thai coco owns the most shelf · 100% of SKUs. Store brands hold 1%. The shelf leans organic · 5% of SKUs carry that claim. Verdict: contested · real competition, no single winner (opportunity 68/100).
110
products
16
brands
$5.93
avg price
$0.03-$0.29 /fl oz
typical range
More in Canned & Jarred
Who owns the shelf
brands by share of the coconut milk shelf.
How it's positioned
the claims products on this shelf lead with · share of SKUs carrying each.
Organic
5%
Vegetarian
5%
Plant-Based
5%
Dairy-Free
5%
Market structure
59
medBrand competition
how many brands compete
64
medVariety of offers
how differentiated the shelf is
20
lowTop-brand grip
how much a few brands dominate
68
highLaunch whitespace
room for a new brand
store-brand share: 1% · scores 0-100.
Top products
the coconut milk products in the most Bay Area grocers · widest distribution first.
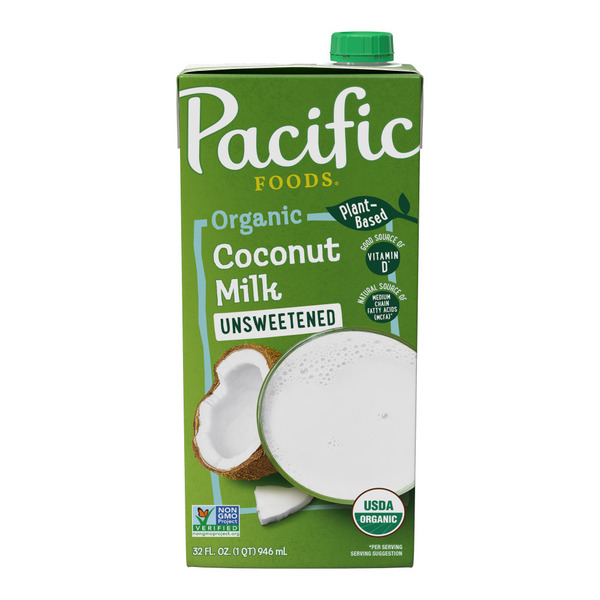
Pacific Foods Organic Unsweetened Coconut Milk
$3.9912 grocers
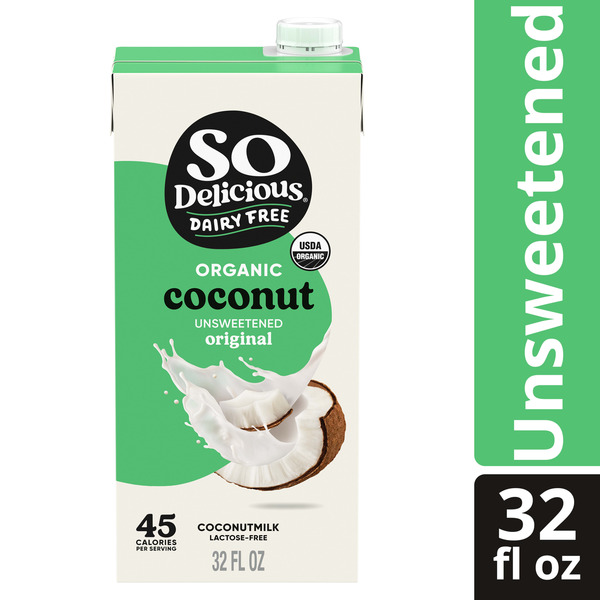
So Delicious Shelf-Stable Organic Coconut Milk, Unsweet, 32 fl oz
$3.9910 grocers
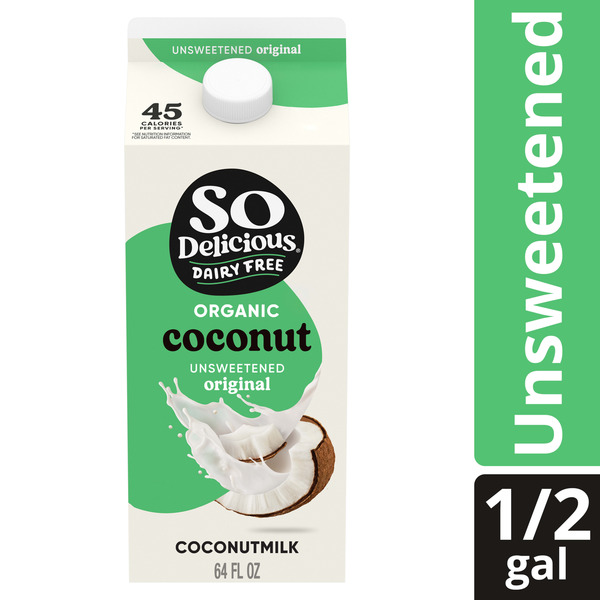
So Delicious Dairy Free Organic Coconut Milk Beverage Unsweetened
$5.997 grocers
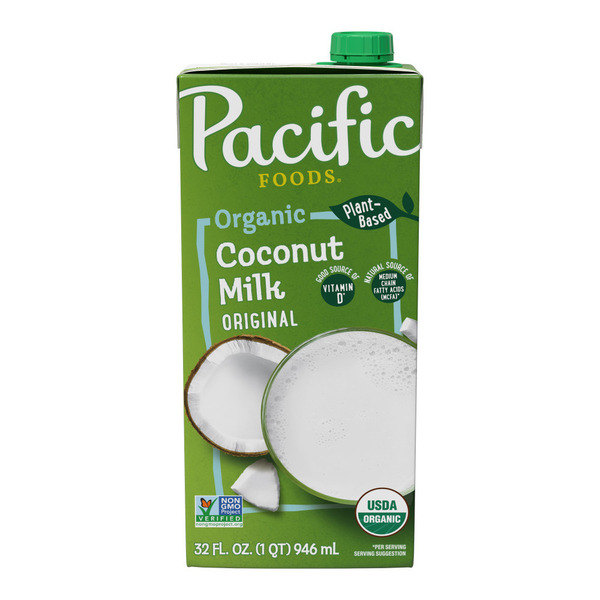
Pacific Foods Organic Coconut Milk
$3.996 grocers
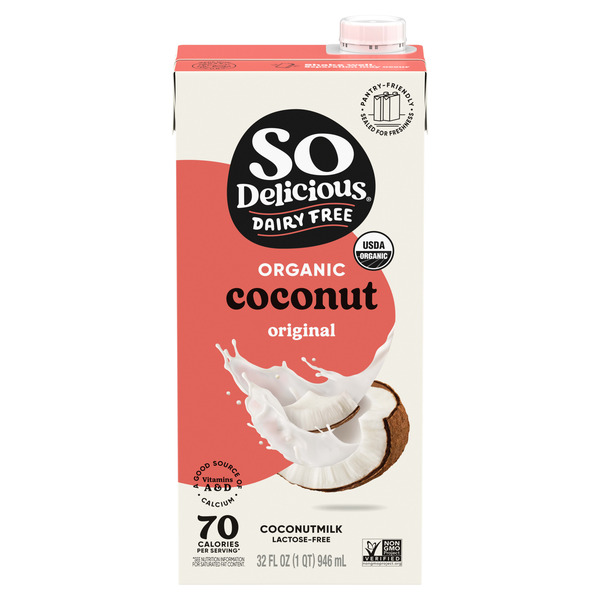
So Delicious Dairy Free Original Organic Coconutmilk
$4.496 grocers
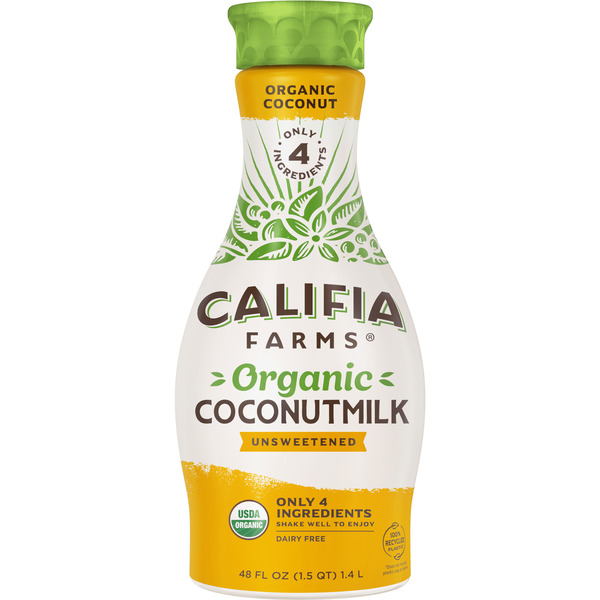
Califia Farms Organic Coconut Milk
$5.996 grocers
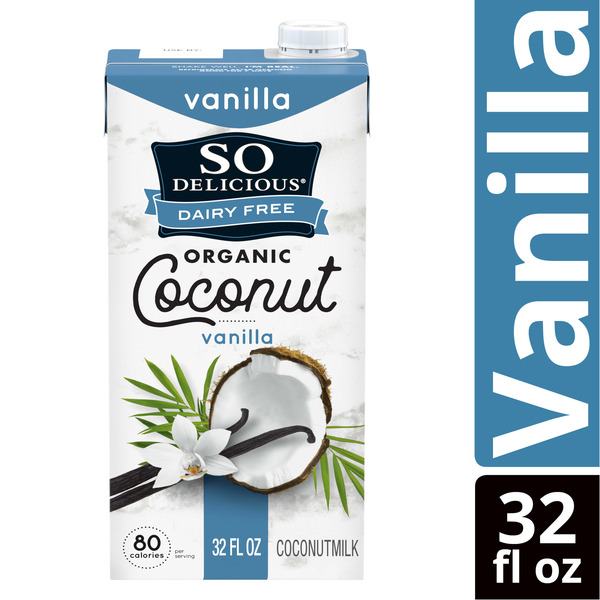
So Delicious Shelf-Stable Organic Coconut Milk, Vanilla, 32 fl oz
$3.995 grocers
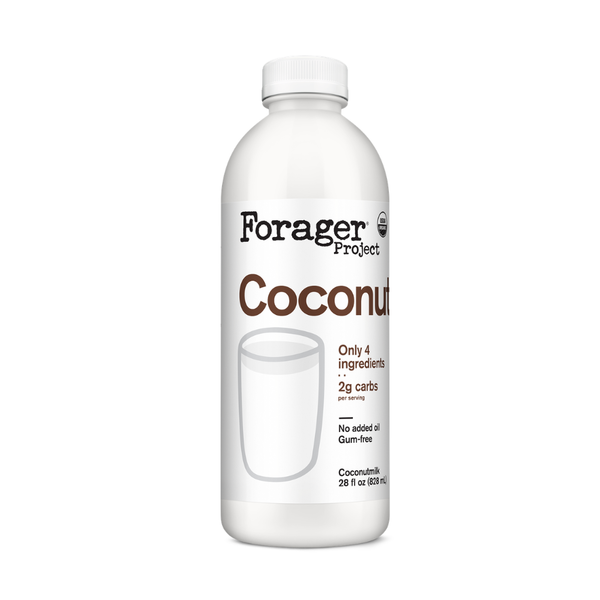
Forager Project Organic Coconut Milk
$4.895 grocers
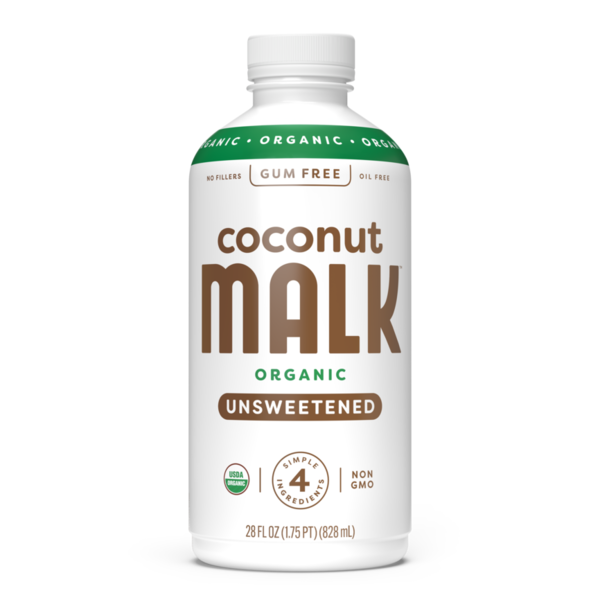
MALK Organic Unsweetened Coconut Milk - Dairy Free
$6.295 grocers
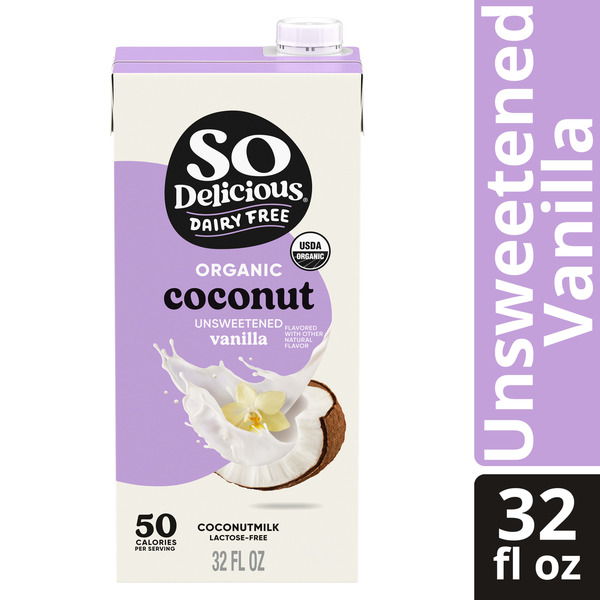
So Delicious Dairy Free Coconut Milk Unsweetened Vanilla
$3.994 grocers