Bay Area · 19 grocers · Contested🔥 heat 88 · HOT
the canned anchovies aisle
Bay Area's canned anchovies aisle is a fragmented shelf spread across many brands: 131 products from 20 brands across 19 grocers. talatta owns the most shelf · 34% of SKUs, ahead of agostino recca. The shelf leans dairy-free · 10% of SKUs carry that claim. Verdict: contested · real competition, no single winner (opportunity 61/100).
131
products
20
brands
$9.93
avg price
$1.52-$10.75 /oz
typical range
More in Canned Seafood
Who owns the shelf
brands by share of the canned anchovies shelf.
Brand positioning
every brand by share of shelf × price. bubble size = the brand's total reach across all aisles; color = positioning stance. top-right owns the premium end; bottom-right owns the mainstream.
scale
Color:no dominant segmentation on this shelf
Size:total brand reach (SKUs across all aisles)
price normalized per oz (sizes vary)3 omitted (no oz size)All stores combined.
Market structure
67
highBrand competition
how many brands compete
86
highVariety of offers
how differentiated the shelf is
10
lowTop-brand grip
how much a few brands dominate
61
medLaunch whitespace
room for a new brand
store-brand share: 0% · scores 0-100.
Top products
the canned anchovies products in the most Bay Area grocers · widest distribution first.
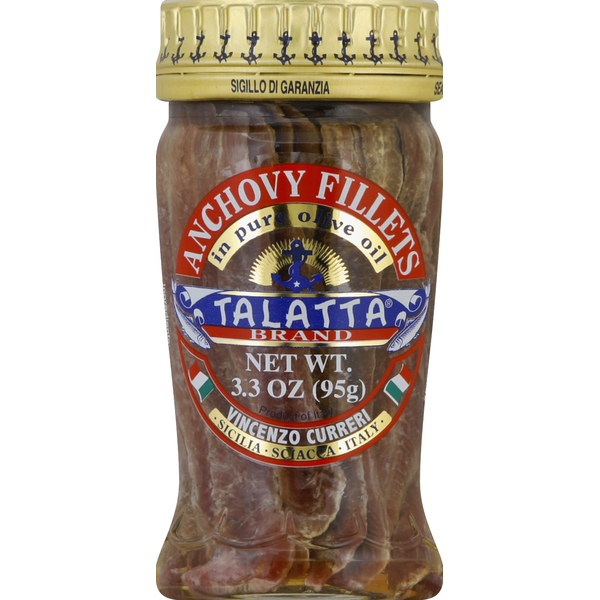
Talatta Anchovy Fillets, in Pure Olive Oil
$3.0911 grocers

Fishwife Anchovies in Extra Virgin Olive Oil
$7.298 grocers
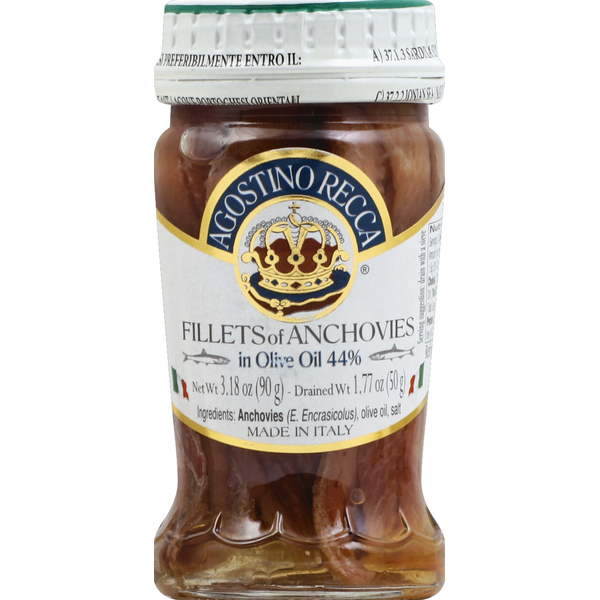
Agostino Recca Fillets of Anchovies
$8.598 grocers
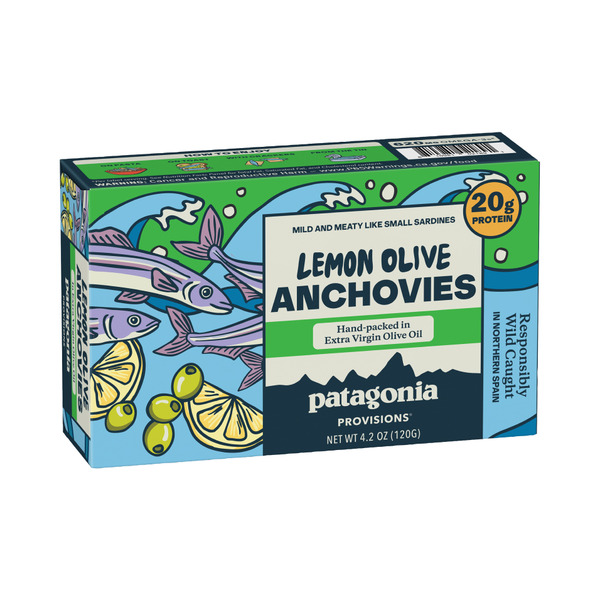
Patagonia Provisions Lemon Olive Spanish White Anchovies
$7.497 grocers
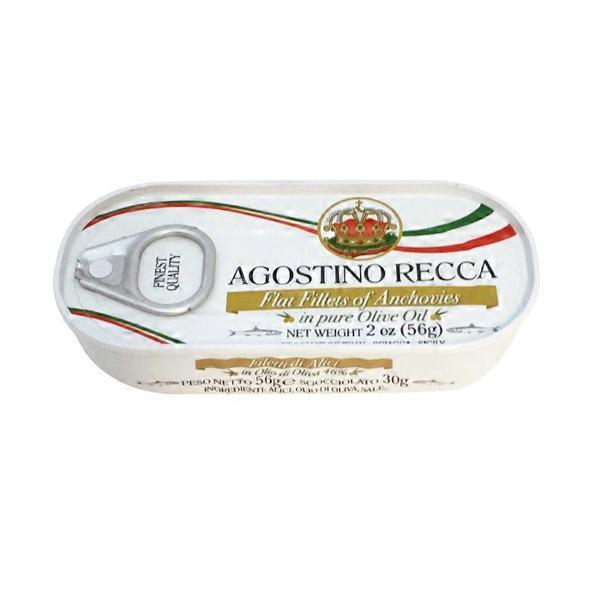
Agostino Recca Flat Fillets Of Anchovies In Olive Oil
$5.796 grocers
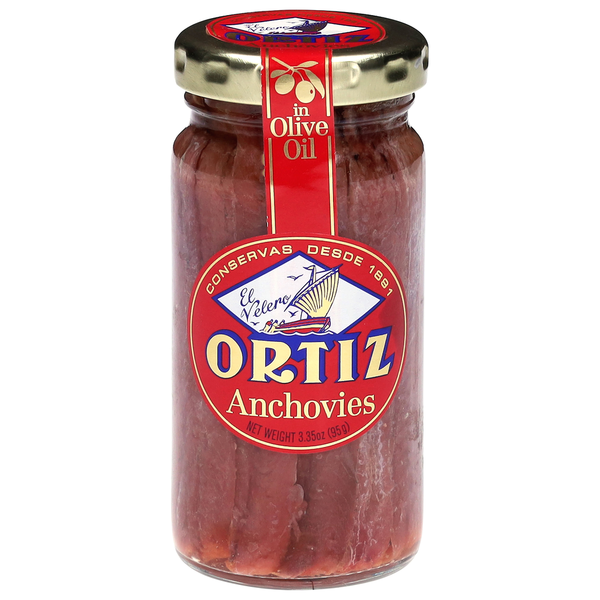
Conservas Ortiz Anchovies
$16.096 grocers

Cento Flat Fillets of Anchovies
$3.695 grocers
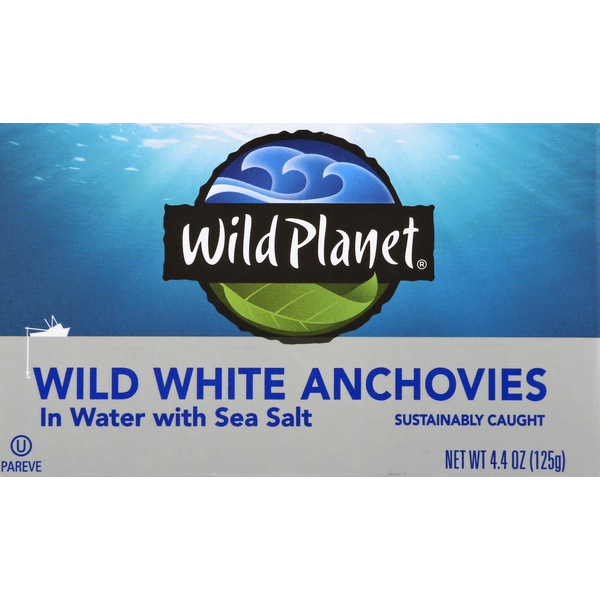
Wild Planet Anchovies in Water with Sea Salt, Wild White
$3.795 grocers
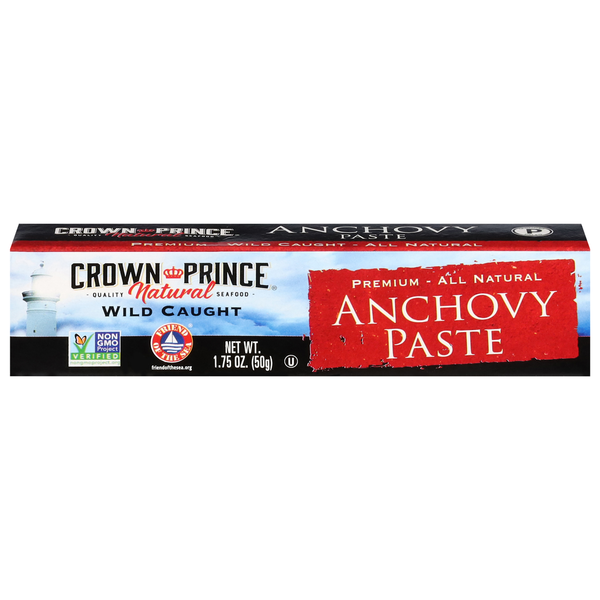
Crown Prince Anchovy Paste, Wild Caught
$4.095 grocers
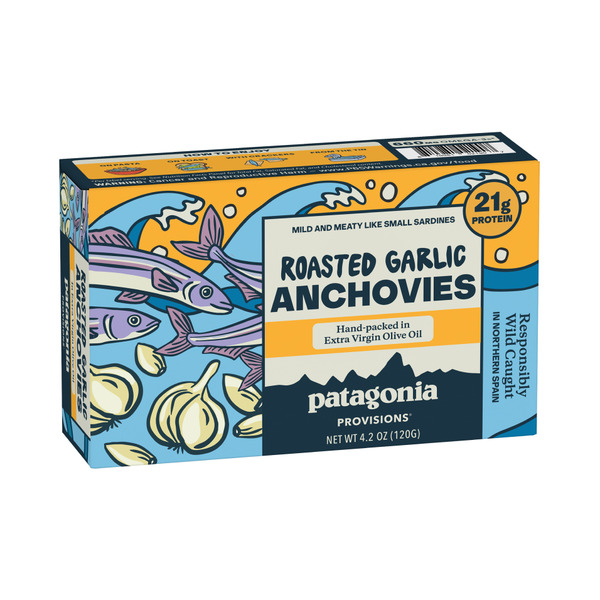
Patagonia Provisions Spanish White Anchovies, Roasted Garlic
$7.695 grocers