Bay Area · 21 grocers · Contested🔥 heat 90 · HOT
the canned kidney beans aisle
Bay Area's canned kidney beans aisle is a fragmented shelf spread across many brands: 134 products from 21 brands across 21 grocers. le conserve della nonna owns the most shelf · 61% of SKUs, ahead of senesi. Store brands hold 2%. The shelf leans organic · 4% of SKUs carry that claim. Verdict: contested · real competition, no single winner (opportunity 60/100).
134
products
21
brands
$3.59
avg price
$0.13-$0.35 /oz
typical range
More in Canned Beans
Who owns the shelf
brands by share of the canned kidney beans shelf.
How it's positioned
the claims products on this shelf lead with · share of SKUs carrying each.
Organic
4%
Plant-Based
Market structure
69
highBrand competition
how many brands compete
66
medVariety of offers
how differentiated the shelf is
11
lowTop-brand grip
how much a few brands dominate
60
medLaunch whitespace
room for a new brand
store-brand share: 2% · scores 0-100.
Top products
the canned kidney beans products in the most Bay Area grocers · widest distribution first.
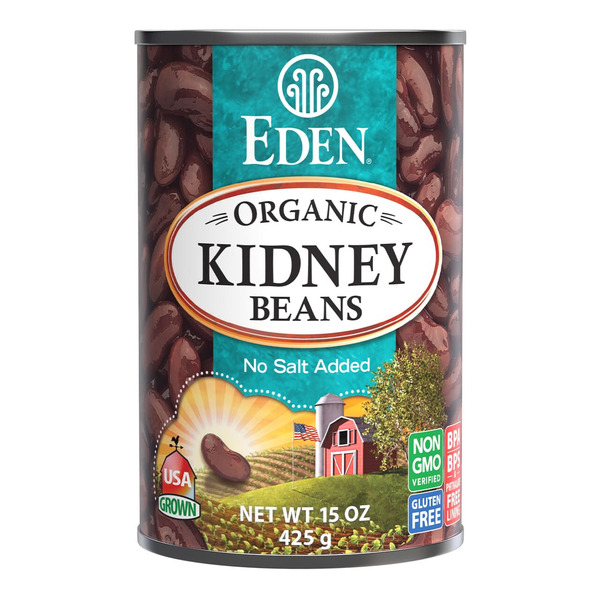
Eden Foods Kidney (dark red) Beans, organic
$3.6911 grocers
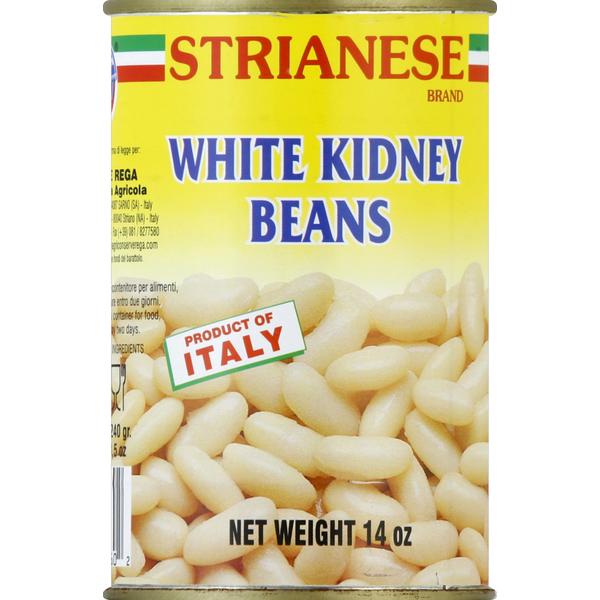
Strianese Kidney Beans, White
$2.1910 grocers
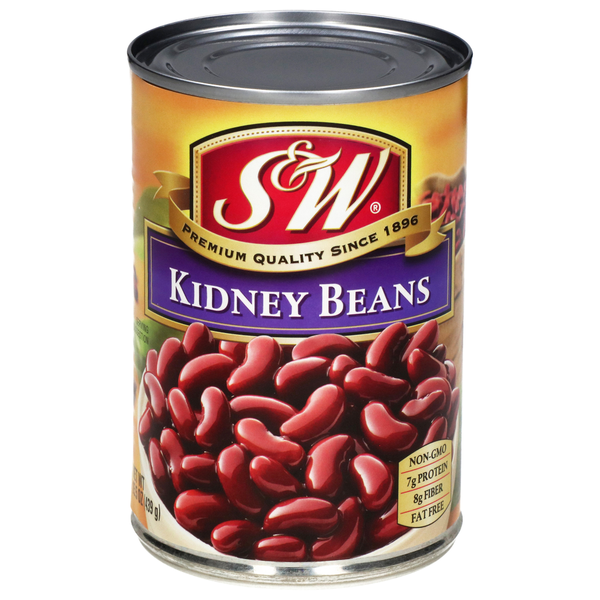
S&W Kidney Beans
$1.699 grocers
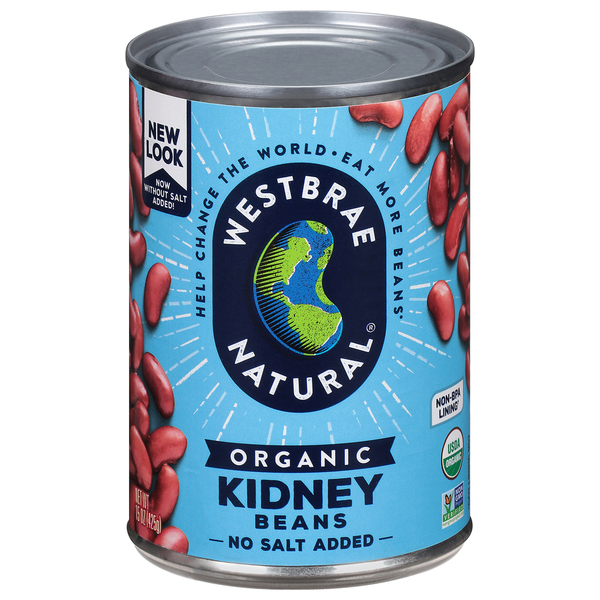
Westbrae Natural Organic No Salt Added Kidney Beans
$3.509 grocers
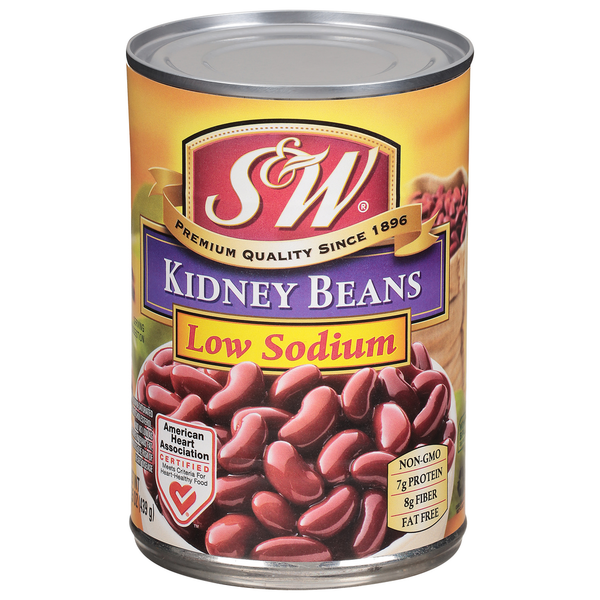
S&W Kidney Beans, Low Sodium
$1.697 grocers
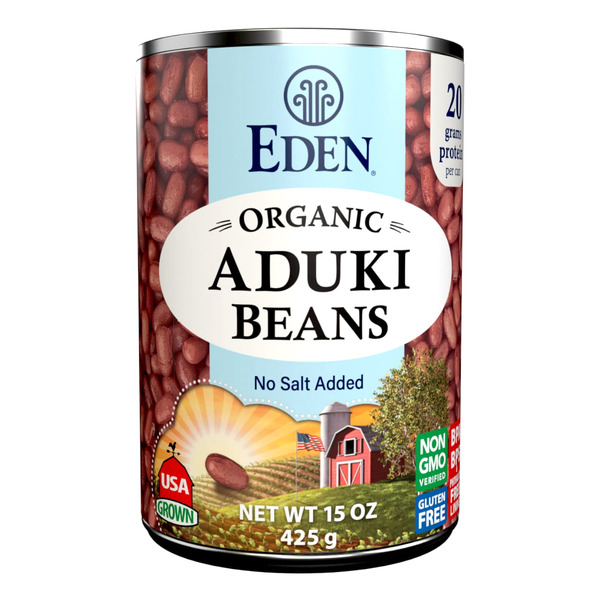
Eden Foods Aduki Beans, organic
$3.697 grocers
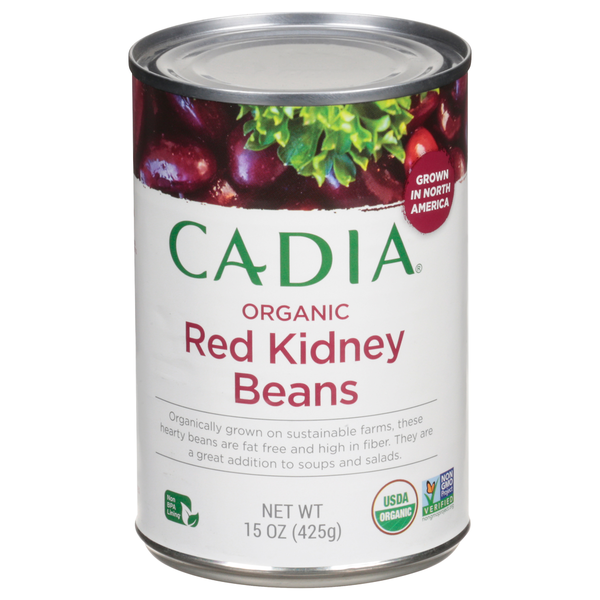
CADIA Red Kidney Beans, Organic
$1.696 grocers
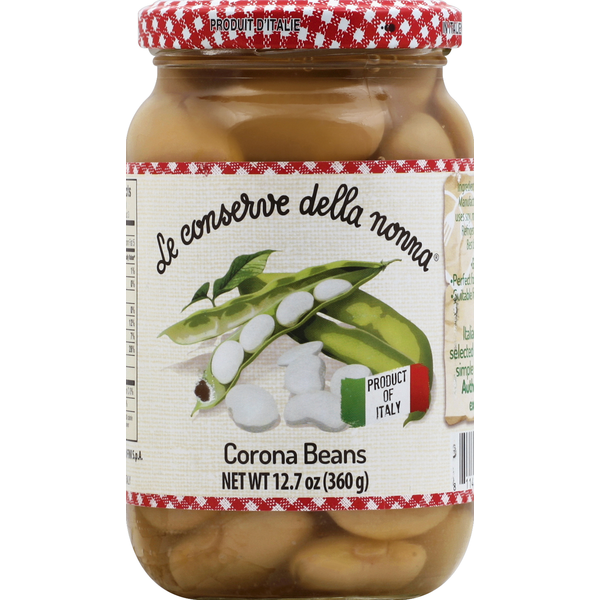
Le Conserve Della Nonna Beans, Corona
$3.396 grocers

Jack's Quality Kidney Beans, Organic, Low Sodium
$3.095 grocers
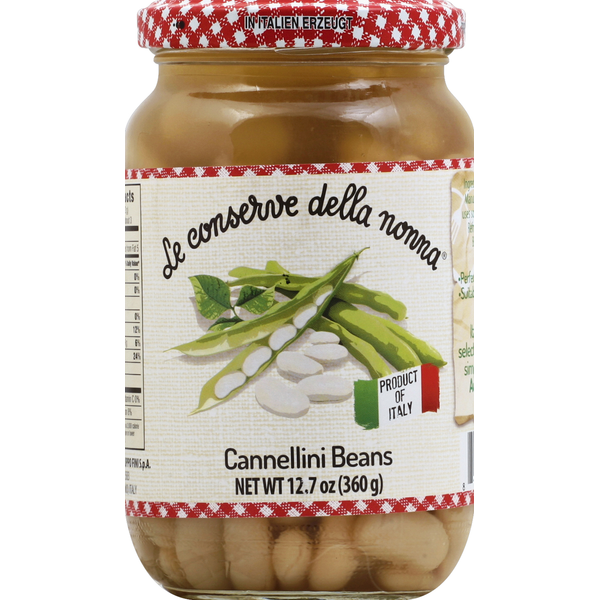
Le Conserve Della Nonna Beans, Cannellini
$3.395 grocers