Bay Area · 17 grocers · Leader-led🔥 heat 90 · HOT
the canned baked beans aisle
Bay Area's canned baked beans aisle is a competitive shelf with clear leaders: 102 products from 13 brands across 17 grocers. bush's best owns the most shelf · 74% of SKUs, ahead of van camp’s. The shelf leans plant-based · 4% of SKUs carry that claim. Verdict: leader-led · a clear front-runner, but not yet a lock (opportunity 69/100).
102
products
13
brands
$4.54
avg price
$0.13-$0.49 /oz
typical range
More in Canned Beans
Who owns the shelf
brands by share of the canned baked beans shelf.
Brand positioning
every brand by share of shelf × price. bubble size = the brand's total reach across all aisles; color = positioning stance. top-right owns the premium end; bottom-right owns the mainstream.
scale
Color:indulgentbetter-for-you
Size:total brand reach (SKUs across all aisles)
price normalized per oz (sizes vary)All stores combined.
Market structure
51
medBrand competition
how many brands compete
66
medVariety of offers
how differentiated the shelf is
34
medTop-brand grip
how much a few brands dominate
69
highLaunch whitespace
room for a new brand
store-brand share: 0% · scores 0-100.
Top products
the canned baked beans products in the most Bay Area grocers · widest distribution first.
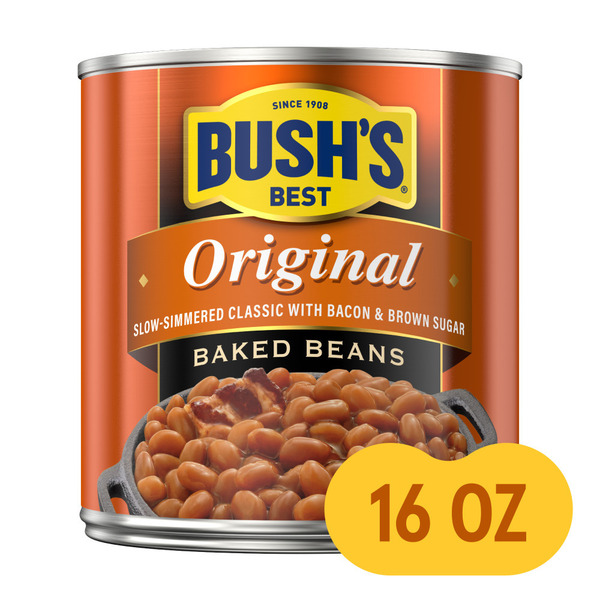
Bush's Best Original Baked Beans
$2.889 grocers

Bush's Best Vegetarian Baked Beans
$2.888 grocers

Amy's Kitchen Traditional Vegetarian Baked Beans
$4.497 grocers
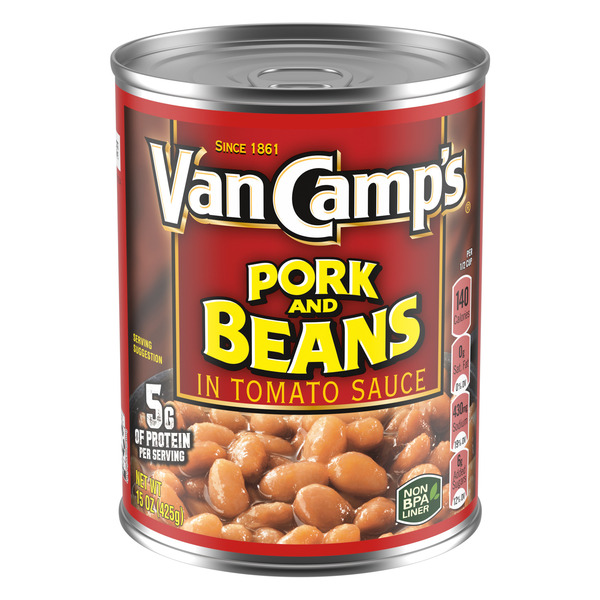
Van Camp’s Pork and Beans with Tomato Sauce, Canned Beans
$1.996 grocers

Bush's Best Homestyle Baked Beans
$2.885 grocers

Bush's Best Vegetarian Baked Beans
$2.885 grocers
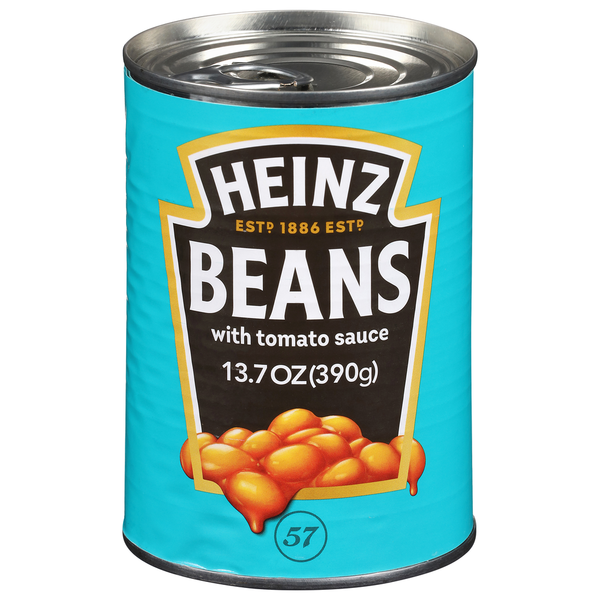
Heinz Baked Beans with Tomato Sauce
$5.495 grocers

B&M Original with Molasses, Pork & Spices Baked Beans
$2.794 grocers

Bush's Best Original Baked Beans
$2.884 grocers

Bush's Best Country Style Baked Beans
$2.884 grocers